stevepickering.net |
|
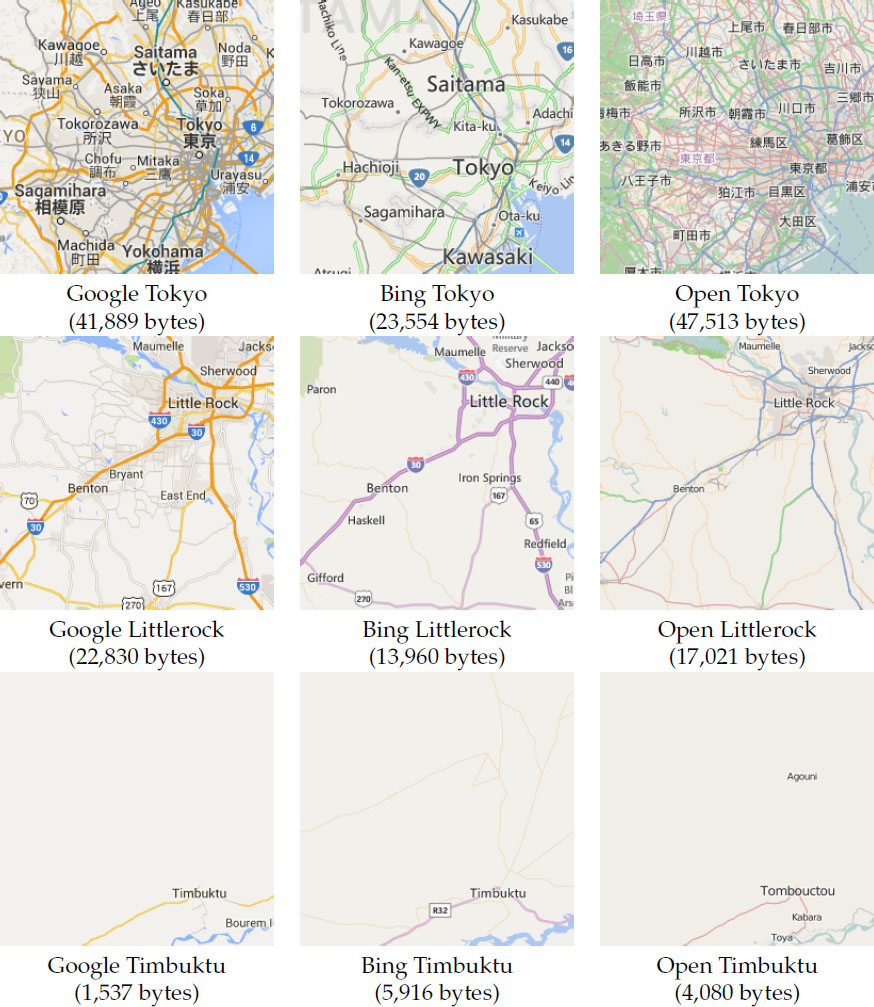
New way of measuring infrastructure developmentMany social scientists have needed to include a measure of infrastructure or road density in their research. To do this, they have often used the Digital Chart of the World (DCW). For many reasons, this is problematic. To solve this problem, a new R package was created, called infra (available through CRAN).
 If you create a grid, and then find the file size for each cell in the grid, you can create an image like the one below. 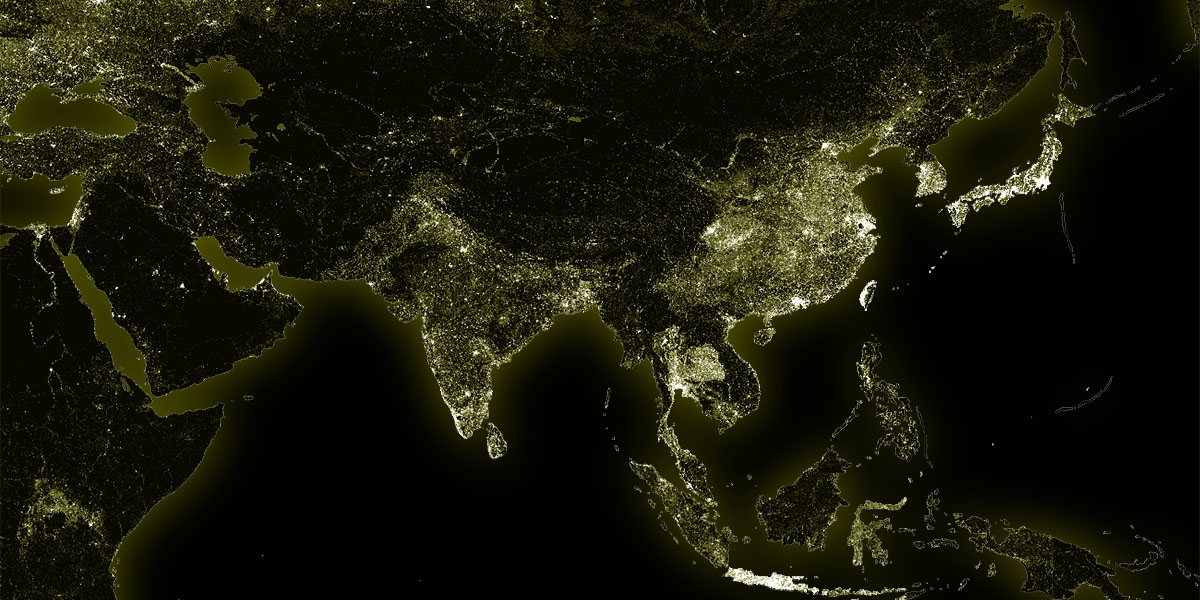 This grid was 1300 cells wide by 660 cells tall, so the file sizes of 858,000 Google map images were determined to create this image.
|
Steve doesn't do Facebook |
 but he does do